One Dashboard for the
Whole Maintenance Team
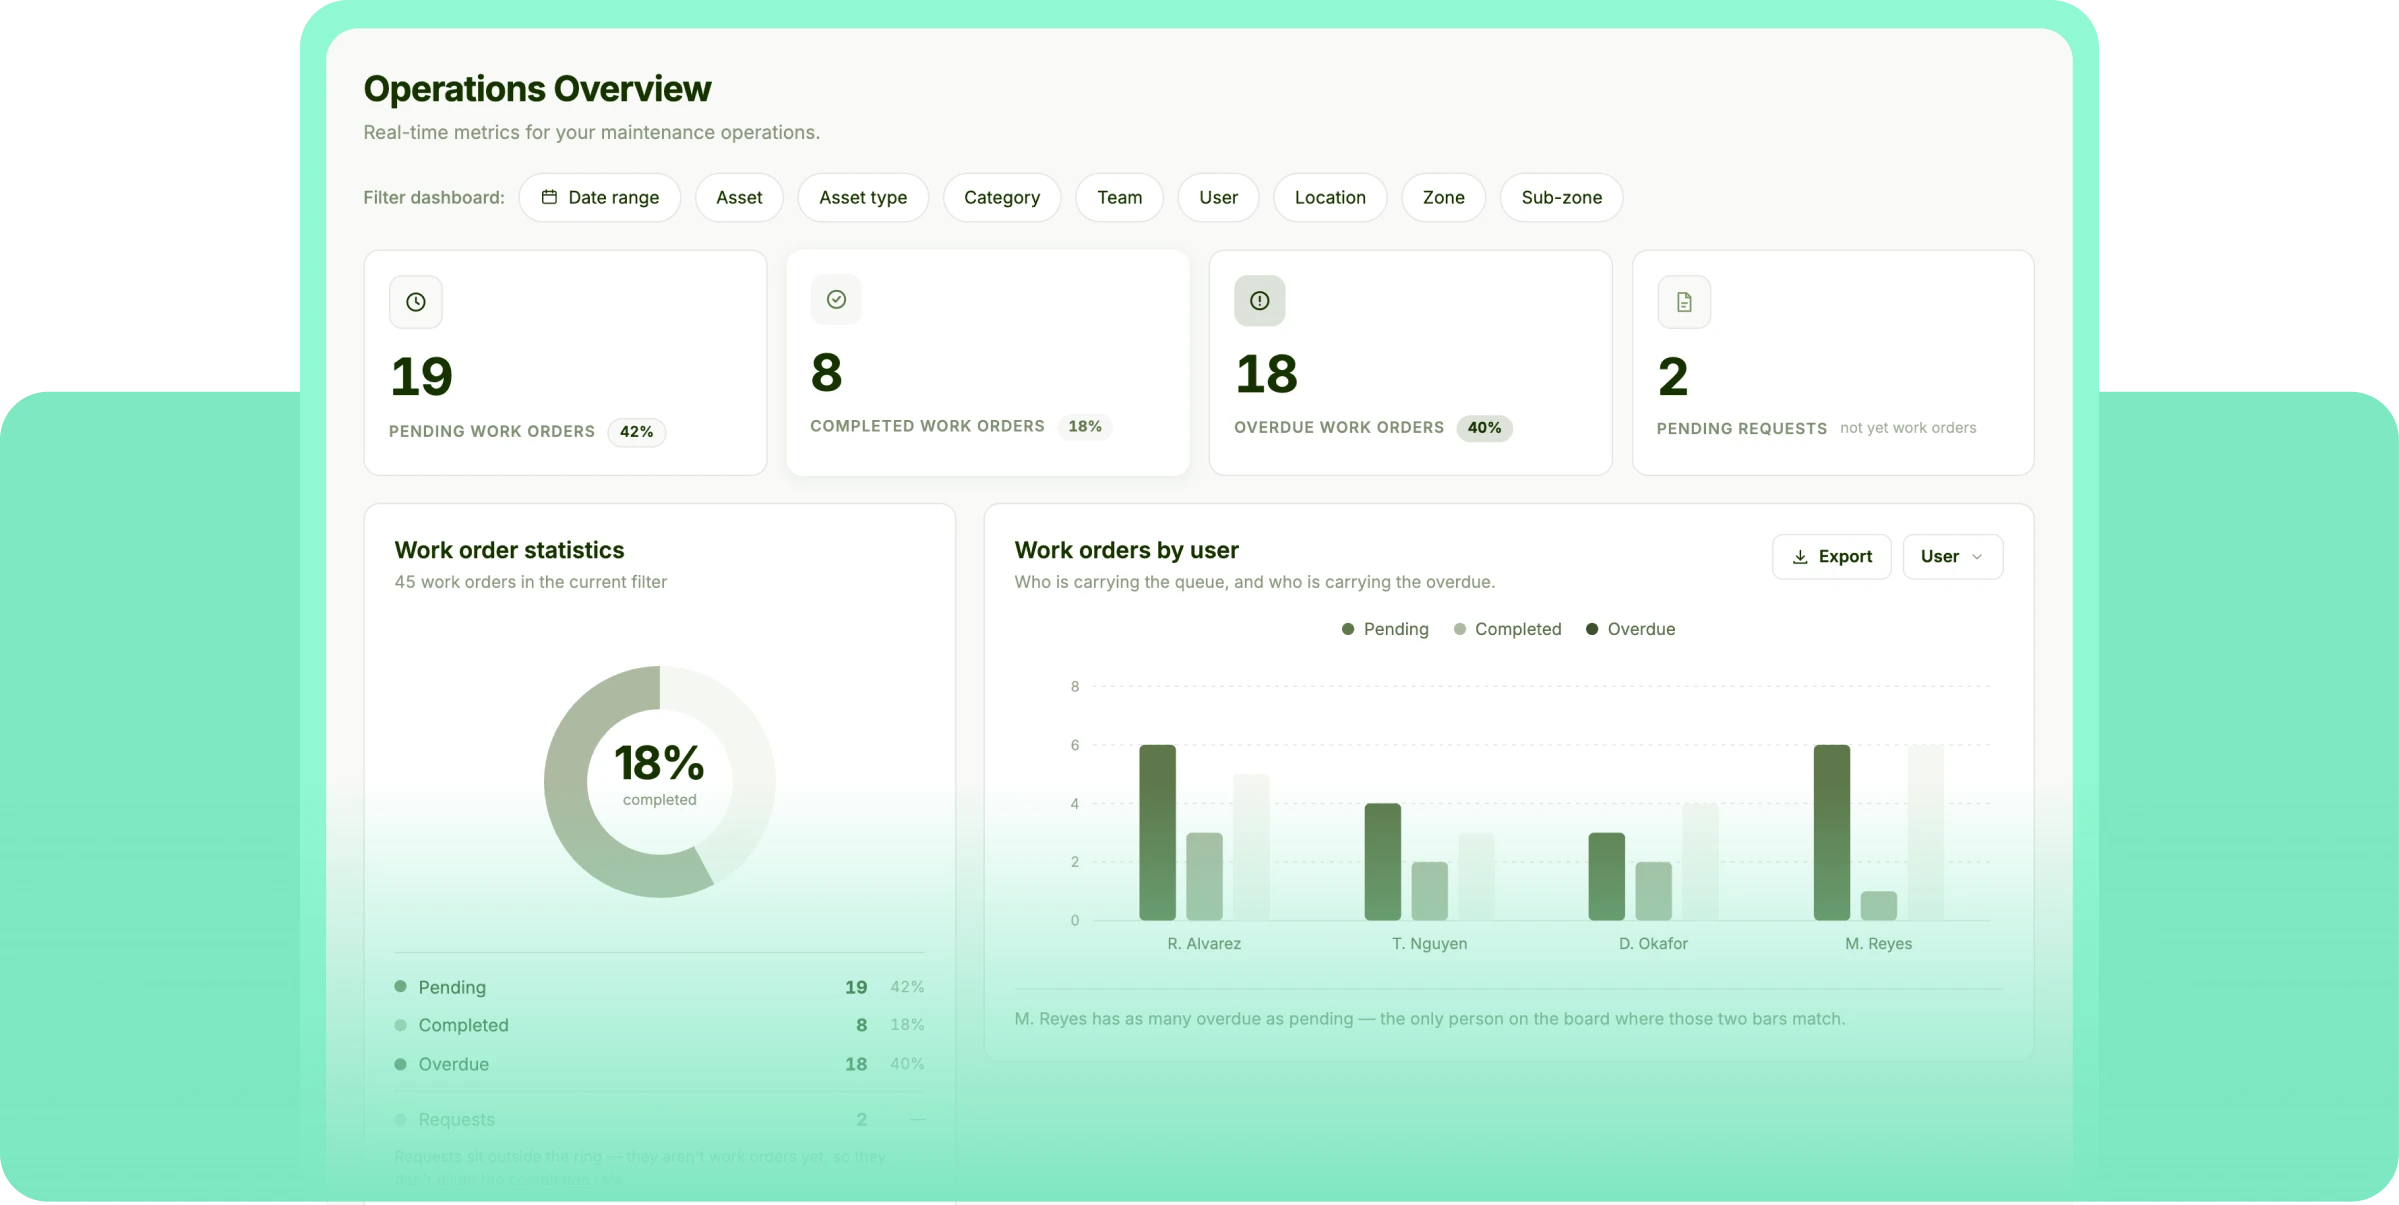
Compliance, backlog, cost and downtime on a single live view — filtered to a site, a line or one asset.

Every request, work order, part and reading already lands in Opmaint. Reporting turns that record into live dashboards, real cost per asset, and reports that send themselves.
Cut the monthly reporting effort
The report builds itself from the work your team already closed, rather than from an export and a pivot table.
Cut time to answer a cost question
Seven years of spend on one machine is a filter, not an afternoon of three people digging through folders.
Lift the share of jobs closed with real data
Hours, parts and cause are captured as the technician signs off, so the numbers reflect the floor.
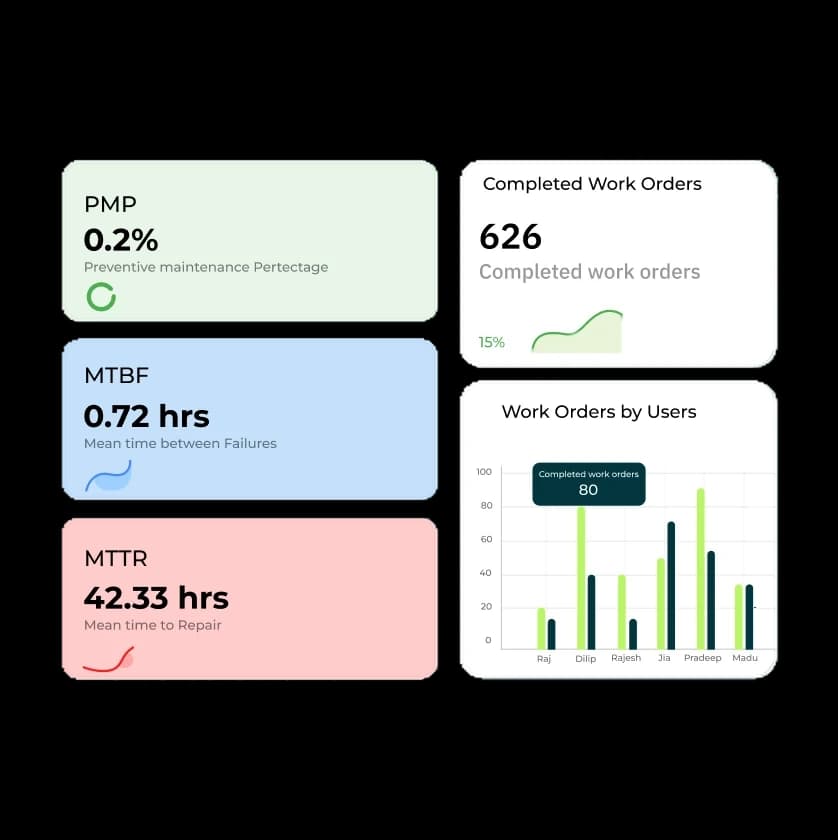
MTBF, MTTR, PM compliance, and backlog — all in one dashboard, updated in real time as work orders close.
Book demoPull any combination of work order, cost, downtime, or parts data into a report — no formulas, no manual exports.
Book demoSet reports to run on a schedule - weekly, monthly or whatever cadence your team needs.
Book demoBenchmark reliability, cost, compliance, teams and asset types across sites to find what’s working — and what isn’t.
Book demo“We were running PMs off a whiteboard and a shared spreadsheet. Six weeks in, every asset on the floor has a schedule and nothing has been missed.”
“Unplanned downtime on our press line dropped by about a third in the first quarter. The trend data made the replacement case for us.”
“My technicians actually use it. They scan the QR on the machine, the history and the manual are right there, and the work order closes on the phone.”
“The migration off MaintainX took two days and cost us nothing. That alone was the reason we could move mid-year instead of waiting.”
“I can finally answer what a machine has cost us over seven years without three people digging through folders for an afternoon.”
“Spare parts used to be the bottleneck on every repair. Now the purchase order raises itself when stock hits the minimum.”
“Audit week used to be a fortnight of preparation. Last time we exported the maintenance record for every asset in about ten minutes.”
“Four sites, one view. I can see which plant is behind on its PMs on a Monday morning without ringing round for a status.”
See a work order close on the floor and land in a scheduled report — in under two minutes.
Compliance, backlog, cost and downtime on a single live view — filtered to a site, a line or one asset.
Labour hours, parts and cause are captured as the work order closes, so every figure traces back to a real job.
Build it once, pick the recipients and the frequency, and the report lands in their inbox without anyone remembering.
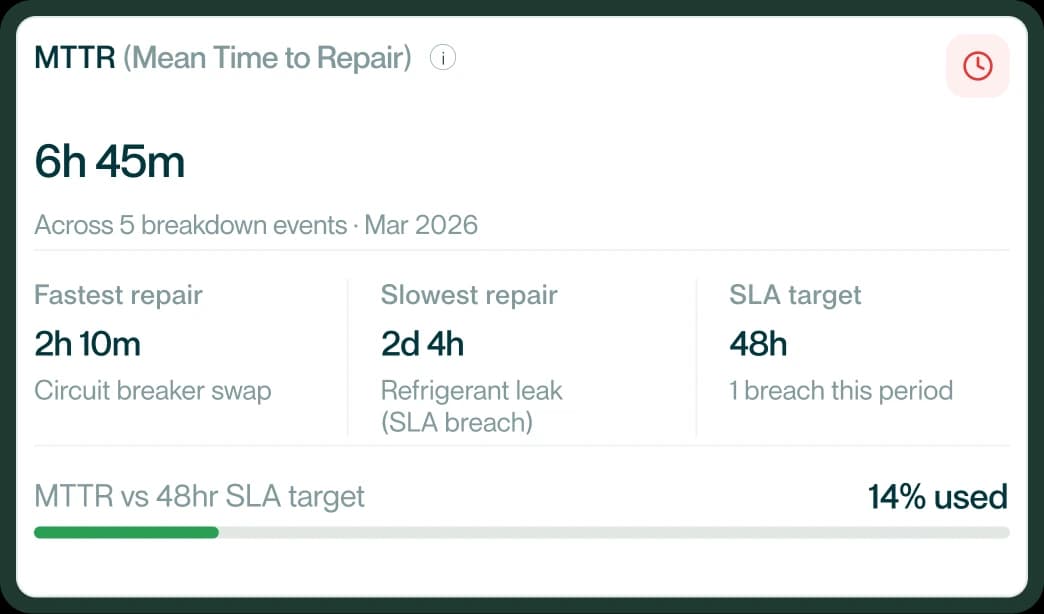
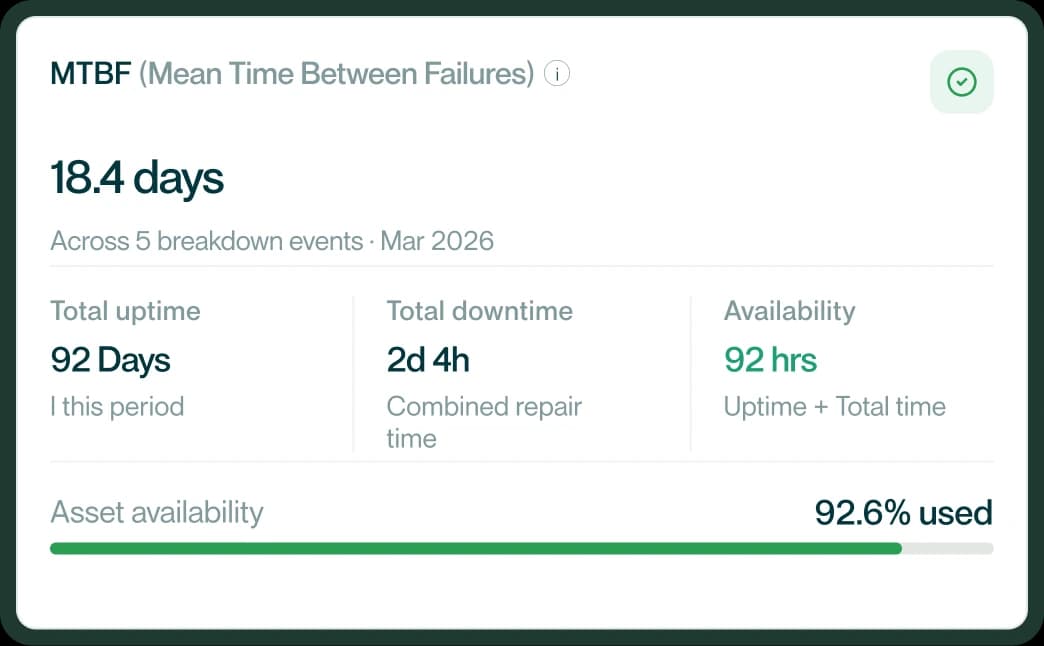
Track MTBF, MTTR, and PM compliance in real time, updated the moment a work order closes — no need to pull numbers by hand.
Build a report from any combination of cost, downtime, or parts data and save it as a template for next month.
See which sites, teams, or asset types are falling behind — and which ones are getting it right — side by side.
| Feature | Opmaint | Legacy software |
|---|---|---|
| Pricing | $399 one-time | $75–120 / month |
| Unlimited Asset Hierarchies | ||
| Unlimited Custom Asset Fields | ||
| Asset QR Codes | ||
| Asset Warranty Tracking | ||
| Downtime Reporting (MTBF, MTTR) | ||
| Asset Snap | ||
| Bill of Materials | ||
| Anomaly Detection | ||
| Asset Check In / Check Out | ||
| Capital Depreciation Tracking | ||
| Asset Geolocation | ||
| Asset Templates |
Comparison figures are illustrative. Legacy pricing varies by vendor and seat count.
Save time and money with the easiest, most complete all-in-one maintenance platform.






Transform data into actionable insights that drive decisions, optimize operations, and deliver measurable business impact.
See our pricing