CMMS ROI: How to Prove the Value of Your Maintenance Program to Leadership

Key TakeAway
Leadership does not speak maintenance.
They speak money.
If you walk into a budget meeting with work order completion rates and PM schedules, you will walk out without approval.
Here is what this guide gives you:
Why Most Maintenance Managers Lose the Budget Argument
Every budget season the same conversation happens.
A maintenance manager walks into a leadership meeting.
He has data on equipment uptime. PM compliance rates. Work order backlogs.
Leadership asks one question.
The Numbers Leadership Needs to See
What is this costing us and what will it save us?
The maintenance manager does not have that answer.
He leaves without the budget.
The problem is not that cmms roi is hard to calculate.
The problem is that most maintenance managers only calculate one or two savings categories and massively understate the total return.
The biggest mistake in CMMS ROI calculation is stopping at labor savings. That category alone captures only 25 to 35% of the total value.
A complete return on investment cmms calculation requires measuring five distinct savings streams.
Most business cases only count one.
That is why budgets get rejected.
This guide fixes that.
What Is CMMS ROI?
CMMS ROI (Computerized Maintenance Management System Return on Investment) measures the financial value generated by your maintenance software compared to the total cost of implementation.
Why Most CMMS Business Cases Fail Before Reaching the CFO
CMMS value is primarily delivered through prevention.
Equipment failures that never happen. Emergency orders never placed. Overtime hours never worked.
These events do not appear on the income statement.
The CFO sees only the subscription cost.
This asymmetry between visible costs and invisible savings is the fundamental challenge of maintenance ROI.
According to research published by the National Institute of Standards and Technology preventable losses due to inadequate maintenance in US manufacturing amount to $119.1 billion annually including $18.1 billion in downtime and $100.2 billion in lost sales from delays and defects.
That is the size of the problem your cmms business case is solving.
Business cases built on operational metrics alone get rejected by finance teams that speak in payback period, NPV, and cost avoidance.
Here is how to build one they cannot reject.
Step 1: Establish Your Baseline Before Calculating ROI
You cannot calculate improvement from an unknown starting point.
Note: The numbers below are illustrative examples built on validated industry benchmarks. Replace the inputs with your facility's actual numbers to generate your site-specific ROI calculation.
The 5 Savings Categories That Drive CMMS ROI
Calculate hidden maintenance costs and build a stronger business case for CMMS investment.
Total baseline cost in this example: $1,288,000 per year.
That is the number you open with in the leadership meeting. Before you mention the CMMS cost.
Step 2: The 5 CMMS Savings Categories You Must Measure
Category 1: Downtime Cost Savings
What It Measures: Financial value of unplanned production stoppages prevented by switching from reactive to preventive maintenance.
NIST Research: Establishments relying primarily on preventive and predictive maintenance have 52.7% less unplanned downtime compared to reactive maintenance.
OpMaint Data: OpMaint customers report 40% reduction in recurring breakdowns with proactive maintenance planning.
Category 2: Labor Productivity Gains
What It Measures: Time recovered when technicians stop searching for information, chasing parts, and manually updating records.
Industry Benchmark: 5 hours per week per technician lost to manual admin in spreadsheet-based operations.
OpMaint Data: OpMaint improves response times across manufacturing operations by 32%.
Category 3: Emergency Repair Cost Reduction
What It Measures: Cost difference between emergency reactive repairs and planned preventive maintenance.
Industry Benchmark: Emergency repairs cost 3–5 times more than planned maintenance.
Category 4: Parts Inventory Optimization
What It Measures: Savings from eliminating stockouts, reducing emergency procurement premiums, and right-sizing inventory.
OpMaint Data: Real-time inventory tracking eliminates emergency procurement premiums.
Category 5: Asset Life Extension
What It Measures: Value generated by extending equipment lifespan through consistent preventive maintenance.
NIST Research: Preventive maintenance reduces defects and extends equipment performance cycles.
The Complete CMMS ROI Calculation
Here is the full cmms business case for a 10-technician manufacturing facility using Opmaint Premium at $39 per user per month billed annually:
Putting It All Together
When all five savings categories are measured together, the ROI becomes impossible to ignore.
Book Demo with Opmaint today and see how our team helps you build a custom ROI calculation using your facility's actual data.
Step 3: Present to Leadership the Right Way
Knowing the numbers is only half the battle.
Presenting them in language leadership responds to is the other half.
Here is the proven framework for justify cmms investment presentations that get approved:
How to Present a CMMS Business Case Leadership Approves
Most CMMS proposals fail because they focus on maintenance. Leadership focuses on financial outcomes.
Don't start with “We need a CMMS.”
Start with “Here is what our maintenance program is costing the business right now.”
Total Cost of Inaction: $1.2M
The cost of inaction is approximately 147× higher than the CMMS investment, making the decision financially obvious.
The 5 Year Value of CMMS Investment
cmms cost savings compound over time as your team masters the system and PM programs mature.
Projected Financial Impact Over 5 Years
A long-term view helps leadership understand the true value of preventive maintenance and CMMS adoption.
| Year | Annual Value | Annual Cost | Net Value |
|---|---|---|---|
| Year 1 | $709,200 | $8,180 | $701,020 |
| Year 2 | $780,000 | $8,180 | $771,820 |
| Year 3 | $850,000 | $8,180 | $841,820 |
| Year 4 | $920,000 | $8,180 | $911,820 |
| Year 5 | $990,000 | $8,180 | $981,820 |
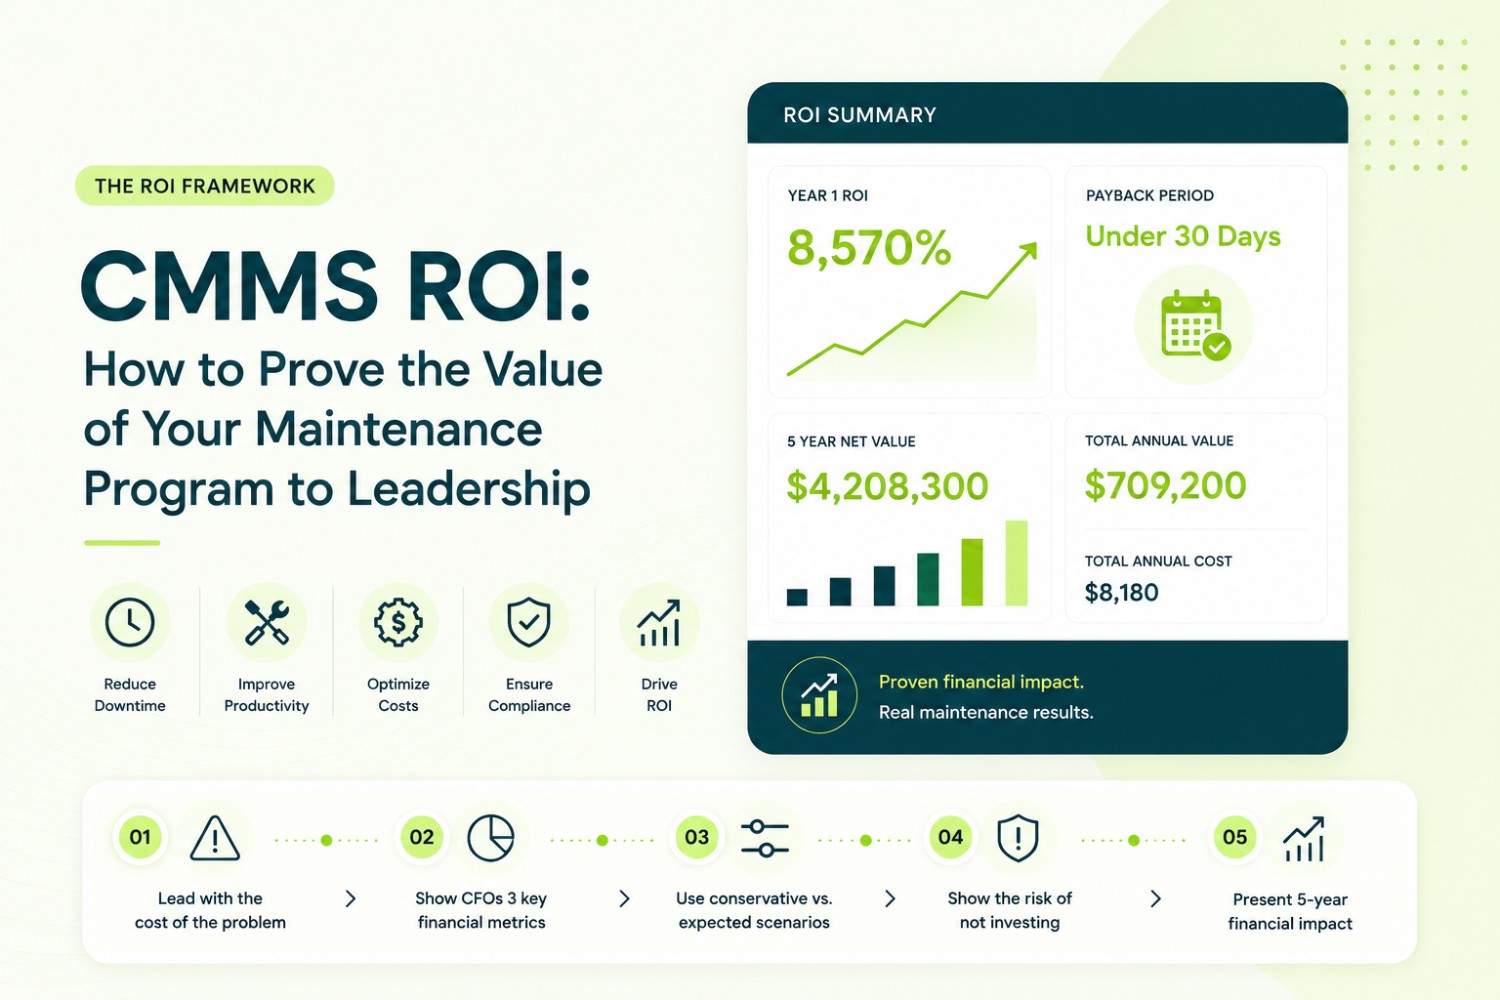
| 5 Year Total | $4,249,200 | $40,900 | $4,208,300 |
5 Year ROI: 10,288%
A 5 year projection reveals total value that a 1 year payback number dramatically understates.
Show this table to leadership and the conversation changes from can we justify this to why have we not done this already.
CMMS ROI by Industry: Validated Benchmarks
Return on investment from CMMS varies by industry based on downtime cost per hour, asset criticality, and maintenance complexity.
| Industry | Downtime Cost Per Hour | Expected Year 1 ROI | Payback Period |
|---|---|---|---|
| Manufacturing | $260,000 | 400% - 800% | 3 - 6 Months |
| Food & Beverage | $50,000 - $100,000 | 300% - 600% | 4 - 8 Months |
| Chemicals | $100,000 - $300,000 | 500% - 900% | 2 - 5 Months |
| Facility Management | $5,000 - $15,000 | 200% - 400% | 6 - 10 Months |
| Automotive | $200,000 - $400,000 | 600% - 1,000% | 2 - 4 Months |
How Opmaint Delivers Measurable ROI from Week 1
Opmaint is Manufacturing CMMS Software built specifically for maintenance teams that need to prove program value to leadership with real data not anecdotal reporting.
Week 1 to 2:
- PM work orders generate automatically. No missed tasks.
- Technicians complete work orders on mobile from the production floor.
- Parts inventory tracked in real time. No manual counts.
- Available in 6 languages: English, Hindi, Tamil, Gujarati, Spanish, and German.
Month 1:
- First prevented breakdown from automated PM scheduling.
- First compliance report generated in minutes not days.
- First real-time dashboard showing MTBF, MTTR, and schedule compliance.
Month 3:
- MTBF trending upward for critical assets.
- Emergency repair frequency dropping measurably.
- Schedule compliance above 80% for the first time.
Month 6:
- Full maintenance cost reduction visible versus pre-Opmaint baseline.
- Leadership sees ROI in the dashboard without a special report.
- Budget renewal becomes about expanding the program not justifying it.
Choose the Right Plan for Your Maintenance Team
Start free and scale as your maintenance operation grows.
What the Budget Conversation Looks Like When You Have the Right Numbers
Here is what happens when maintenance managers walk into a leadership meeting with financial language instead of operational metrics.
A maintenance manager walks in with three numbers.
Payback period of under 30 days.
Year 1 ROI of over 8,000%.
A documented 40% reduction in recurring breakdowns.
The conversation shifts from budget justification to what else can we automate.
That shift only happens when you present ROI in the language leadership understands.
Not work orders and PM compliance rates.
Dollars saved. Dollars protected. Dollars returned.
The Business Case Template: 6 Slides That Get Budgets Approved
Use this structure for your justify cmms investment presentation:
Slide 1: The Problem
Current annual cost of reactive maintenance broken down by category. Total baseline number leads. $1,288,000 per year in this example.
Slide 2: The Benchmark
NIST research showing $119.1 billion in preventable manufacturing losses annually. Your facility's share of that problem.
Slide 3: The Solution
Opmaint CMMS. What it does. How it works. 30 day free trial. Implementation in days not months.
Slide 4: The Numbers
Year 1 ROI across all five categories. Conservative and expected scenarios. Payback period. 5 Year NPV of $4,208,300.
Slide 5: The Risk of Inaction
$1,203,000 cost of inaction in the next 12 months. Make inaction more expensive than action.
Slide 6: The Ask
$4,680 annual investment. 30 day free trial available. Implementation timeline of 4 days. First measurable results expected by Month 1.
That is the presentation that gets approved.
Your Leadership Does Not Need to Believe in Maintenance. They Need to See the Numbers.
The cmms roi case is not a maintenance argument.
It is a financial argument.
And when you present it correctly the numbers make the decision for you.
$709,200 in annual value. $8,180 in annual cost. Payback in under 30 days.
No CFO says no to that.
Opmaint gives your maintenance team the real-time data, automatic reporting, and instant ROI visibility to make that case to leadership every single month.
Not just at budget time.
Stop asking for budget. Start showing leadership what not investing is costing them.
Ready to Prove the Value of Your Maintenance Program?
See exactly how downtime reduction, labor productivity gains, inventory optimization, emergency repair reduction, and asset life extension translate into measurable financial results. Discover the numbers leadership needs to approve maintenance investments with confidence.