How to Use Fishbone Diagrams to Solve Maintenance Problems Efficiently
Maintenance problems can be a headache, right? But there's a tool that's been a game-changer for many maintenance teams: the Fishbone Diagram, also known as the Ishikawa Diagram. Let's dive into how you can use this powerful tool to tackle maintenance issues head-on. Ready? Let's go!
What is a Fishbone Diagram?
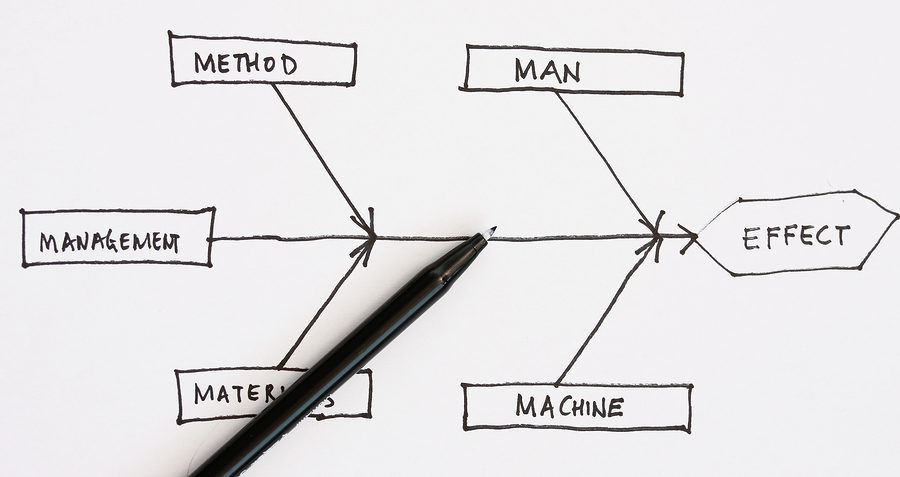
First things first, let's understand what a Fishbone Diagram is. Imagine a fish skeleton – that's essentially what this diagram looks like. It's a visual tool used to systematically identify the root causes of a problem. Each "bone" of the fish represents a category of potential causes, and these categories branch out into more specific causes. Sounds simple, right?
The Origins of the Fishbone Diagram
A quick history lesson: The Fishbone Diagram was created by Professor Kaoru Ishikawa in the 1960s. Ishikawa was a Japanese organizational theorist and a pioneer in quality management processes. His diagram was designed to help teams get to the root cause of issues systematically. And it's still widely used today, proving its effectiveness over decades.
Why Use Fishbone Diagrams for Maintenance Problems?
Now, you might be wondering, why should I use a Fishbone Diagram for maintenance issues? Here’s why:
- Structured Approach: It provides a structured way to brainstorm and organize potential causes of problems.
- Visual Clarity: The visual nature of the diagram makes it easy to understand and communicate.
- Root Cause Analysis: It helps you dive deep into the root causes rather than just addressing symptoms.
- Team Collaboration: It encourages team participation, bringing diverse perspectives to the table.
Key Components of a Fishbone Diagram
Before we jump into creating one, let's break down the main components of a Fishbone Diagram:
- The Head (The Problem Statement): This is where you write the main issue you're trying to solve.
- The Spine: The central line that leads to the problem statement.
- The Bones (Categories of Causes): Major categories that contribute to the problem.
- The Smaller Bones (Sub-causes): Specific factors within each category that could be causing the issue.
Step-by-Step Guide to Creating a Fishbone Diagram
Alright, let's get hands-on. Here’s how you can create a Fishbone Diagram to tackle maintenance problems:
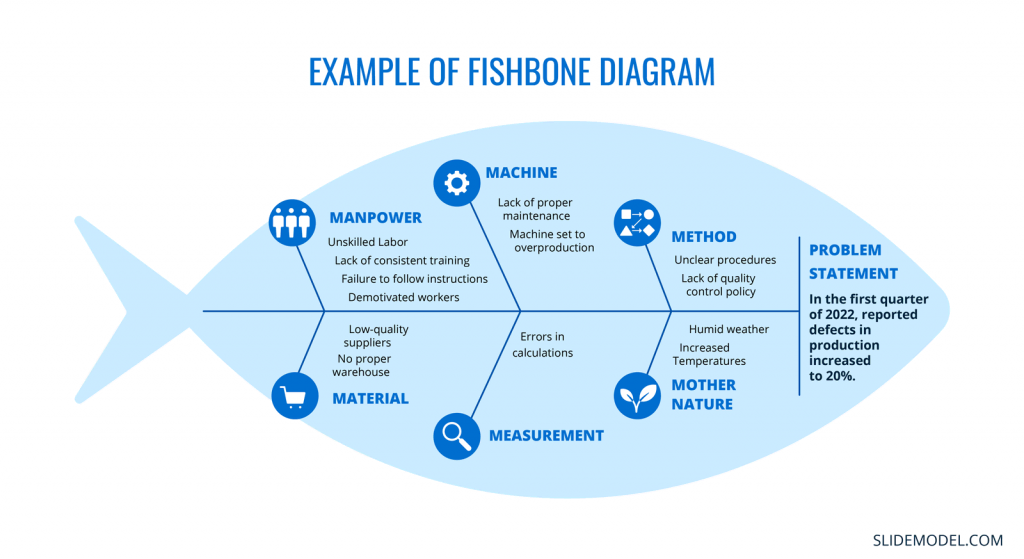
- Identify the Problem: Clearly define the maintenance issue you want to address. For example, "Frequent machine breakdowns."
- Draw the Spine and Head: Draw a horizontal line (the spine) and add the problem statement at the end (the head).
- Brainstorm Major Categories: Think about the major categories that could be contributing to the problem. Common categories include Methods, Machines, Materials, People, Environment, and Measurement.
- Add Sub-causes: Under each category, list specific causes that could be contributing to the problem. Be thorough and consider all possibilities.
- Analyze the Diagram: Review the diagram with your team. Look for patterns and identify the most likely root causes.
- Develop Action Plans: Create action plans to address the root causes identified. Implement changes and monitor their impact.
Example: Fishbone Diagram for Machine Downtime
Let’s walk through a practical example. Suppose your maintenance team is facing frequent machine downtimes. Here's how you might map it out:
- Problem Statement: Frequent machine downtimes.
- Categories:
For each of these categories, you’d then brainstorm more specific causes and add them to your diagram.
Common Pitfalls to Avoid
Using a Fishbone Diagram is powerful, but there are a few common pitfalls to watch out for:
- Lack of Focus: Ensure the problem statement is clear and specific.
- Overlooking Categories: Don’t ignore any major category; each could hold key insights.
- Incomplete Analysis: Be thorough in identifying sub-causes.
- Ignoring Follow-up: After identifying root causes, ensure you follow through with action plans.
Benefits of Using Fishbone Diagrams
So, what can you gain from using Fishbone Diagrams for maintenance problems? Here are some benefits:
- Enhanced Problem-Solving: You’ll have a clear, structured approach to tackle issues.
- Improved Team Collaboration: It fosters teamwork and diverse thinking.
- Root Cause Focus: You’ll address the root causes, not just the symptoms.
- Better Communication: The visual format makes it easy to communicate issues and solutions.
Integrating Fishbone Diagrams with Opmaint
Here’s where Opmaint comes in. Our CMMS (Computerized Maintenance Management System) can make using Fishbone Diagrams even more effective. With Opmaint, you can:
- Track Maintenance Issues: Record and track maintenance problems systematically.
- Data Collection: Gather data on equipment performance, maintenance schedules, and more.
- Analyze Trends: Identify patterns and trends that can feed into your Fishbone Diagrams.
- Collaborate Efficiently: Share diagrams and action plans with your team seamlessly.
- Monitor Progress: Keep tabs on the implementation of solutions and their effectiveness.
Opmaint’s tools make it easy to not only create Fishbone Diagrams but also ensure that the insights you gain from them are actionable and tracked over time.
Case Study: Successful Implementation of Fishbone Diagrams at Toyota
Toyota, a global leader in automotive manufacturing, is renowned for its robust quality management practices. One of the tools they frequently use is the Fishbone Diagram. Here’s a real-world example of how Toyota utilized this tool to solve a maintenance problem:
- Problem Statement: Frequent defects in the welding process on the production line.
- Categories and Sub-causes:
By mapping out these causes, Toyota identified that their welding machines were not being calibrated regularly, and the quality of welding rods was subpar. They implemented a more rigorous calibration schedule and sourced higher quality materials. This led to a significant reduction in welding defects, enhancing overall production quality.
Tips for Creating Effective Fishbone Diagrams
Here are some tips to ensure your Fishbone Diagrams are effective:
- Be Specific: Clearly define your problem statement and ensure it’s specific.
- Involve the Team: Brainstorm with your team to get diverse perspectives.
- Stay Organized: Keep your diagram neat and organized for clarity.
- Use Data: Support your analysis with data where possible.
- Review Regularly: Revisit and update your diagram as new information comes to light.
Tools and Resources
To create your Fishbone Diagrams, you can use various tools and resources:
- Pen and Paper: A classic and simple way to start.
- Whiteboards: Great for team brainstorming sessions.
- Software Tools: Use tools like Microsoft Visio, Lucidchart, or online Fishbone Diagram makers.
Conclusion
Fishbone Diagrams are an invaluable tool in the maintenance world. They provide a structured, visual way to get to the root of problems, making it easier to implement effective solutions. And with Opmaint by your side, you can enhance this process even further, ensuring that your maintenance operations run smoothly and efficiently.
So next time you face a maintenance issue, grab a Fishbone Diagram, gather your team, and start brainstorming. You’ll be surprised at how effective this simple tool can be!

.webp)

.jpeg)